
Living Graphs
Making Living Graphs Physical
Starting with an explanation …
A living graph combines a timeline as the horizontal axis and an extent (e.g. success to failure), emotion, attitude or debate as the vertical axis.
The outline below shows these two kinds of axis as they are at the beginning of a living graph activity – the graph has yet to be built up. The topic is the Civil War in the 1640s and the activity is designed to overcome the common misunderstanding that Parliament intended to execute Charles from the beginning of the war. It’s easy for students to assume that that was the intention all along because that is what happened in the end.
So it’s important that the ‘empty graph’ is exactly that – empty to begin with.
What brings it alive is the addition of students or objects to form the line of the graph. Students are given information cards which explain Parliament’s attitude to negotiation or execution at eight points on the timeline axis. Students then have to decide where each card (represented by a student or object) goes on the vertical axis – the resulting graph shows clearly that Parliament only reached the decision to execute Charles very late in the 1640s.
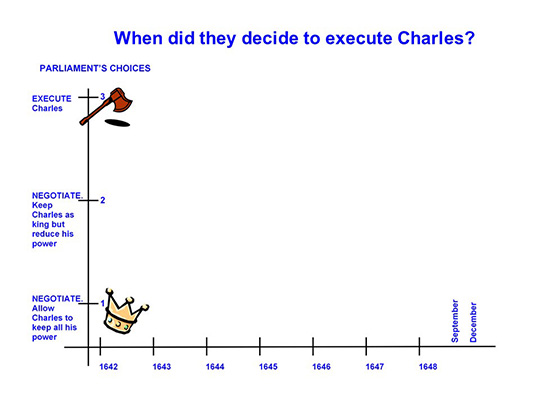
A living graph – ready for the students to annotate of act out
Living Graphs: The Full Article
In addition to the example of the execution of Charles I've described this technique in more detail in a PDF, which also covers:
• Using living graphs to target students misunderstandings and problems
• Concluding thoughts on living graphs
Download the PDF HERE …
Note: Various other terms are used for living graphs, such as Lifelines and Living Timelines – but they are the same activity.
Some Examples of Living Graph Activities on this Website
For a further discussion of approaches to and value of Living Graphs see the article:
Timelines, Time-Stories and Developing Students' Confidence
at A level and GCSE HERE ...
And more examples of living graphs include:
Why was it such a surprise to have a Tudor king? (KS3) HERE …
Henry Tudor's Road to the Throne (A Level) HERE …
When did they decide to execute Charles? HERE …
World War Two Living Graph HERE …
Germany 1918–1939: Living Timeline HERE …
South Africa in the 1930’s & 40’s: A Living Timeline HERE …
How do you feel about the countrys new religion?
An overview 1547-1700 HERE …
When did Prime Ministers and Parliament become more powerful
than the monarch? HERE …
The Big Story of Everyday Life HERE …
Germs have feelings too! A Lifeline HERE …